Understanding Number Trends in Shillong Teer: Probability, Statistics, and Smart Data Analysis
Quick Summary
Shillong Teer probability statistics are based on historical result analysis rather than guaranteed prediction methods. By reviewing previous winning numbers, frequency distributions, odd-even balance, repeat intervals, hot and cold numbers, and ending-digit trends, players can better understand how results have behaved over time. Statistical analysis helps identify recurring patterns in historical data, but every Shillong Teer draw remains an independent event. Past performance cannot determine future outcomes, making probability charts useful for research and trend analysis rather than certainty.
Key Facts
| Topic | Details |
|---|---|
| Analysis Type | Historical probability and statistical trend analysis |
| Data Used | Previous Shillong Teer results collected over multiple draws |
| Main Metrics | Number frequency, repeat rate, odd-even ratio, ending digits, hot & cold numbers |
| Prediction Accuracy | No statistical method can guarantee future results |
| Best Use | Understanding historical patterns and long-term trends |
| Suitable For | Players researching historical performance before making decisions |
| Important Note | Every draw is independent, so previous outcomes do not influence future results |
Frequently Asked Questions
Is Shillong Teer probability based on mathematics?
Yes. Probability analysis uses historical result data to calculate how frequently specific numbers, endings, or combinations have appeared. These calculations help identify trends but cannot predict the next result with certainty.
Do frequently appearing numbers have a higher chance of winning again?
Not necessarily. Frequently occurring (“hot”) numbers simply appeared more often in previous draws. Since each Shillong Teer draw is independent, historical frequency does not increase the mathematical chance of appearing again.
What statistics are most useful when analysing Shillong Teer results?
Many players study number frequency, repeat intervals, odd-even distribution, high-low balance, ending digits, monthly trends, and yearly performance to understand long-term historical behaviour instead of relying on a single statistic.
Can historical statistics improve prediction accuracy?
Historical statistics can support informed analysis by highlighting recurring patterns and long-term trends. However, they should be viewed as research tools rather than prediction guarantees because future results remain uncertain.
How often should probability statistics be updated?
Probability tables become more meaningful when updated regularly with the latest Shillong Teer results. A continuously updated dataset provides a clearer picture of changing historical trends over time.
Last Updated: July 5, 2026
About the Author
The TeerToday editorial team researches Shillong Teer historical results, probability trends, and statistical patterns using verified result archives. The objective is to publish transparent, data-driven educational content that helps readers understand historical performance while encouraging responsible play. Statistical analysis is provided for informational purposes only and should not be interpreted as guaranteed prediction advice.
Related Resources
Continue your research with these related pages:
Shillong Teer Result Today
Shillong Teer Previous Results
Shillong Teer Common Number
Shillong Teer Prediction Today
Khanapara Teer Result
Khanapara Previous Results
Juwai Teer Result
Night Teer Result
Disclaimer: This article discusses historical statistics and probability concepts for educational purposes. All Shillong Teer results are independent, and no mathematical model, formula, or historical dataset can accurately predict future winning numbers. Always make decisions responsibly.
Introduction
Many followers of Shillong Teer believe that certain numbers repeat frequently and that past results can predict future outcomes. Terms like common numbers, hot numbers, and repeat patterns are widely discussed across Teer platforms, Shillong Teer Probability Statistics.
But how much of this belief is actually supported by probability and statistics?
In this article, we take an educational and logical approach to understanding Shillong Teer numbers—without myths, exaggeration, or false guarantees. Shillong Teer Formula
What Probability Really Means (In Simple Words)
Probability is the study of how likely an event is to happen.
In Shillong Teer:
Each round produces a two-digit number (00–99)
That means there are 100 possible outcomes
Every outcome has a chance of appearing
Importantly, probability does not mean certainty. Just because a number appeared yesterday does not mean it will—or will not—appear today. Shillong Teer Common Number
Is Shillong Teer Random?
Shillong Teer is not computer-random, but it is naturally unpredictable.
Why?
Arrow hits depend on human performance
Each archer’s accuracy varies daily
Environmental factors affect results
Because many small variables combine, the final arrow count behaves like a random outcome, even though it comes from a physical process. Shillong Night Results Teer Daily Updates
Why Do Numbers Repeat in Shillong Teer?
Number repetition is one of the most misunderstood aspects of Teer.
Statistical Explanation
In any system with limited outcomes (00–99):
Repetition is normal
Clusters occur naturally
Gaps between numbers are uneven
For example:
Seeing 23 appear twice in a week is not unusual
Seeing 23 not appear for 20 days is also normal
This does not indicate a hidden rule—it’s basic probability. Night Teer Game Today Result
Understanding “Common Numbers”
Common numbers are numbers that:
Appear frequently over a selected period
Are identified by tracking past results
What Statistics Says
A number appearing often in the past does not increase its future probability
Each round resets probability
Past frequency ≠ future guarantee
Tracking common numbers can be useful for study, but not for certainty.
The Gambler’s Fallacy Explained
A very common mistake in Teer thinking is the Gambler’s Fallacy.
Example
“Number 78 hasn’t appeared for many days, so it must appear soon.”
❌ This is incorrect.
Each Shillong Teer round is independent.
The system does not “remember” past results.
Can Past Results Be Used at All?
Yes—but only educationally, not predictively.
Useful Ways to Analyze Past Results
Understanding range distribution
Studying frequency spread
Learning how randomness behaves
Misuse of Past Results
Claiming guaranteed predictions
Selling fixed-number systems
Promising success rates
Statistics explains behavior—it does not promise outcomes. Juwai Morning Teer Result Previous
House and Ending Analysis – What It Actually Means
Many people analyze:
House (first digit)
Ending (second digit)
Statistical Reality
Each digit (0–9) has equal probability
Patterns appear short-term, not long-term
Long-term data always balances out
House/ending analysis is better seen as trend observation, not forecasting.
Why No Formula Can Guarantee Results
A guaranteed formula would require:
Complete control over arrow hits
Fixed conditions
Zero randomness
Since Shillong Teer depends on human action, such control is impossible.
Any claim of:
“100% sure number”
“Fixed formula”
“Daily guaranteed Teer”
…should be treated as misinformation.
Responsible Interpretation of Statistics
Educational use of statistics helps readers:
Think critically
Avoid emotional decisions
Identify false claims
Respect uncertainty
Statistics should inform understanding, not create unrealistic expectations.
Frequently Asked Questions (FAQs)
Q1: Do repeating numbers mean a pattern exists?
No. Repetition is a normal outcome in probability.
Q2: Are common numbers better choices?
They reflect past data only, not future certainty.
Q3: Can statistics predict exact numbers?
No. Statistics explains likelihood, not exact outcomes.
Conclusion
Shillong Teer numbers may appear patterned, but in reality, they follow the natural rules of probability and variation. Repetition, gaps, and clusters are normal behaviors—not signals of certainty.
Understanding probability helps readers move from belief to logic, from assumption to education. That is the true value of studying Shillong Teer statistics.
Shillong Teer attracts thousands of players every day because it combines traditional archery with number-based prediction. Many participants look for patterns, charts, and historical records to improve their understanding of number behavior. While people often search for “winning formulas,” probability and statistical analysis provide a more realistic way to study past outcomes rather than guarantee future results.
Shillong Teer works differently from regular lottery systems. Archers shoot arrows at a target, and the winning result is generated from the last two digits of the total arrows that hit the target. Players select numbers from 00 to 99 and wait for the result declaration.
Understanding statistical trends can help users identify recurring patterns, frequency distribution, and historical movement of numbers.
How Probability Works in Shillong Teer
Probability measures the likelihood of an event occurring. Since Shillong Teer results are based on the last two digits of the total arrow count, every number from 00–99 theoretically has an equal chance over the long term.
However, many users analyze previous results because short-term patterns sometimes appear within historical datasets.
Basic probability formula:
Probability = Number of favorable outcomes ÷ Total possible outcomes
If there are 100 possible outcomes (00–99):
- Total outcomes = 100
- Probability of selecting one exact number:
1 ÷ 100 = 0.01
That means:
- One specific number has approximately a 1% chance.
- Selecting multiple numbers increases coverage but does not guarantee results.
Studies and game observations consistently suggest that historical patterns may help identify trends, but they do not ensure future outcomes.
Why Players Study Historical Results
Historical data analysis is popular because players believe certain trends may repeat. Common statistical methods include:
Frequency Analysis
This method counts how many times each number appears during a specific period.
Example:
- Number 28 appeared 6 times
- Number 74 appeared 4 times
- Number 19 appeared 8 times
High-frequency numbers attract attention, but frequency alone cannot predict future results.
Gap Analysis
Gap analysis examines how many days pass before a number appears again.
Example:
| Number | Last Appearance | Gap Days |
|---|---|---|
| 14 | 3 days ago | 3 |
| 56 | 8 days ago | 8 |
| 92 | 12 days ago | 12 |
| 38 | 2 days ago | 2 |
Some users focus on long-gap numbers believing they may return soon.
Trend Analysis
Trend analysis studies recent result movement over:
- 7 days
- 15 days
- 30 days
- Monthly charts
This method helps identify clusters and recurring endings.
Statistical Table for Shillong Teer Number Study
The following table shows a sample structure for studying historical probability trends:
| Analysis Type | Purpose | Benefit |
|---|---|---|
| Frequency Count | Measures repeated numbers | Identifies commonly appearing values |
| Gap Tracking | Measures missing intervals | Helps monitor inactive numbers |
| Ending Analysis | Tracks last-digit patterns | Detects repeated endings |
| Weekly Trend | Reviews recent movement | Finds short-term behavior |
| Monthly Review | Evaluates long patterns | Identifies broader trends |
| Combination Study | Studies paired numbers | Finds repeated combinations |
This structure helps organize large amounts of historical result data for easier decision-making.
Common Statistical Approaches Used by Players
Players often combine multiple analytical methods rather than depending on a single strategy.
1. Ending Number Observation
Many players track repeated ending digits:
Example:
- 12
- 32
- 52
- 72
- 92
All these numbers end with digit 2.
When a particular ending appears frequently, some users monitor that sequence for future observations.
2. Number Pair Tracking
Certain paired combinations sometimes attract attention:
Examples:
- 14–41
- 28–82
- 67–76
These are commonly called mirrored combinations.
3. Chart-Based Study
Result charts allow users to:
- Compare previous weeks
- Observe frequency movement
- Identify repeating structures
- Record hit and miss sequences
Historical chart tracking remains one of the most widely used approaches among enthusiasts.
Does Statistics Guarantee Winning Numbers?
The simple answer is no.
Shillong Teer remains a game influenced by randomness. Statistical models only help interpret past records. Even if a number appears frequently over several days, it does not automatically increase its chance of appearing again tomorrow.
Experts and historical studies repeatedly emphasize that probability analysis should be viewed as a reference tool rather than a prediction engine.
Important Factors Affecting Result Variations
Several elements can influence result behavior:
- Total arrows hitting the target
- Daily shooting conditions
- Natural variation
- Random distribution patterns
- Human performance factors
Since outcomes depend on actual archery results, exact forecasting remains difficult.
Smart Tips for Better Number Analysis
If you regularly review Shillong Teer data, consider these practical approaches:
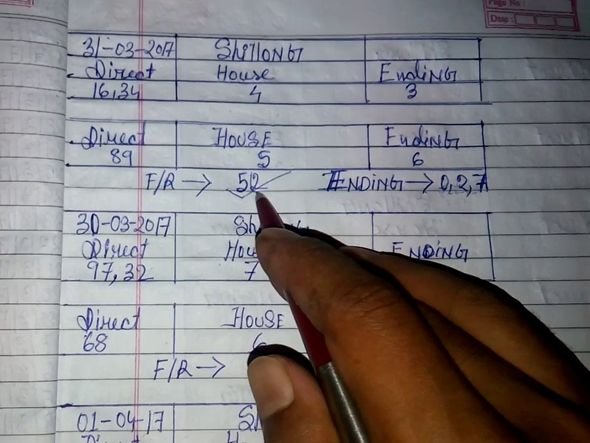
- Maintain a daily result notebook
- Study 15–30 day charts
- Compare frequency and gap data together
- Avoid depending on one formula
- Analyze patterns objectively
- Treat predictions as observations rather than certainty
Maintaining structured records often provides a clearer picture than random guessing.
Final Thoughts
Probability and statistics make Shillong Teer analysis more structured and data-driven. Instead of relying on myths or unsupported formulas, many users now prefer chart reviews, frequency tracking, and trend analysis.
Understanding historical movement can help create informed observations, but no mathematical approach can guarantee exact outcomes. The most effective approach is using statistics as an educational tool while recognizing the role of chance in every draw.
As more players move toward analytical methods, data-based study continues to become an important part of understanding Shillong Teer trends and behavior.
Write more, thats all I have to say. Literally, it seems as though you
relied on the video to make your point. You obviously know what youre talking about, why waste your intelligence on just posting
videos to your blog when you could be giving us
something enlightening to read?
SLOT365 login tái định nghĩa trải nghiệm cá cược thể thao với hơn 4.000 giải đấu mỗi tháng, cung cấp tỷ lệ kèo chính xác và cập nhật liên tục theo biến động thị trường. TONY06-05